
Features
Visual Settings
Enhance your chart readability with dynamic colors and visual market insights.

Color Options
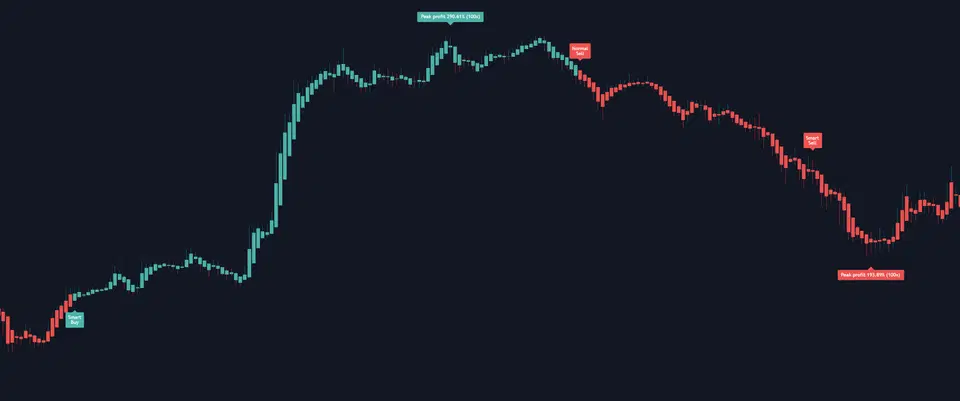
Signal-Based Bar Colors
What it does: Colors candles based on last signal direction
How it works:
- After a buy signal → Bullish color
- After a sell signal → Bearish color
- Shows current bias
Buy Signal → Green bars
↓
Continue green until...
↓
Sell Signal → Red bars
Visual Comparison
Enabled

Clear trend direction
Disabled
Standard candles
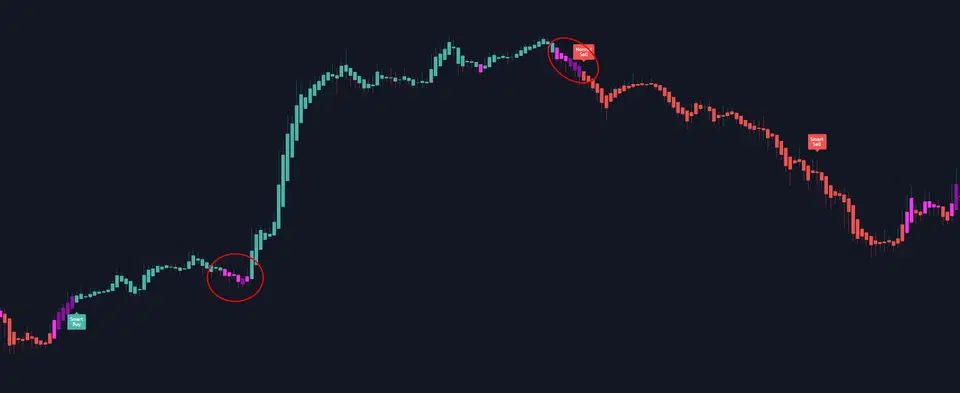
Momentum Weakening Indicator
What it does: Purple shades show signal strength fading
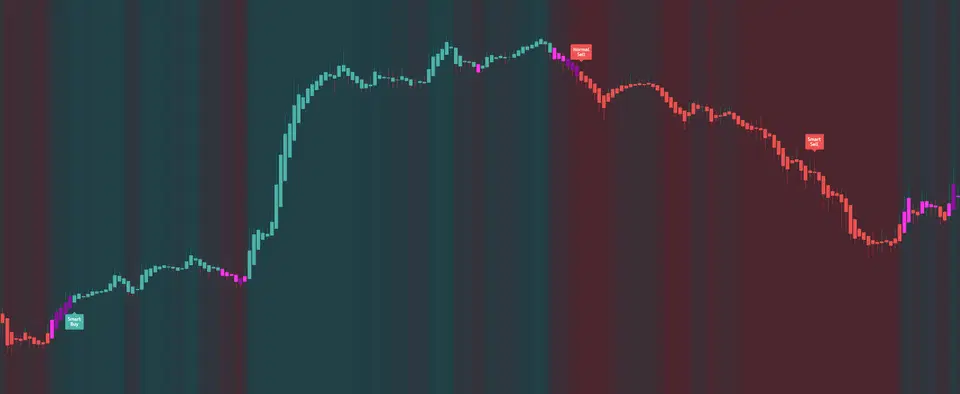
Color Meanings:
| Color | Indicates | Action |
|---|---|---|
| Light Purple | Initial weakening | Watch for reversal |
| Dark Purple | Strong weakening | Potential exit/reversal |
| Theme Color | Strong trend | Continue position |
Visual Example
Dynamic Background Gradient
What it does: Background color shows market momentum

How it works:
- Gradient based on oscillator
- Bearish → Bullish colors
- Smooth transitions
- Ambient market feel
Bearish momentum → Red gradient
Neutral → Mixed colors
Bullish momentum → Green gradient
Visual Impact

Best for: Quick market sentiment at a glance
Historical Peak Display
What it does: Keeps last trade’s peak profit visible
Benefits:
- Review past performance
- Compare with current setup
- Learn from history
- Track improvement
Chart Example
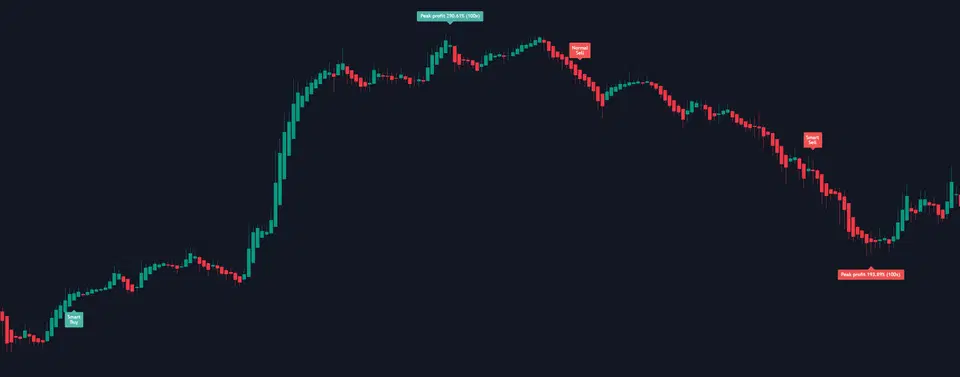
Visual Combinations
Maximum Information
All features ON:
- Full color bars
- Purple weakening signals
- Gradient background
- Peak profit display
Best for: Active monitoring
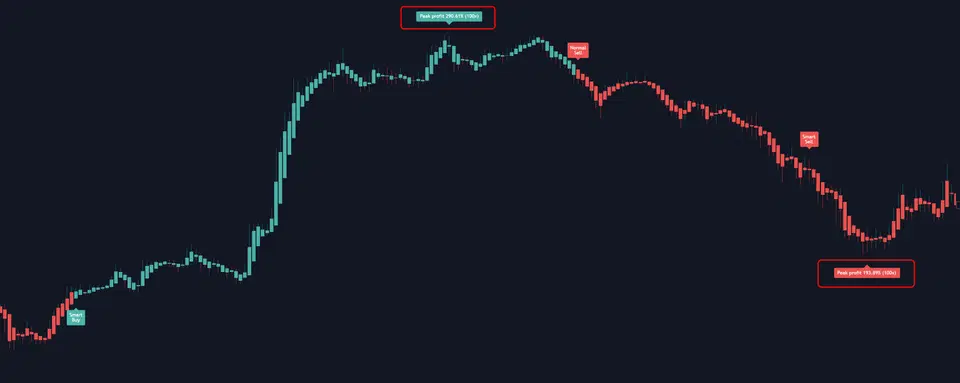
Minimal Distraction
Only essentials:
- Bar color ON
- Everything else OFF
Best for: Clean analysis
Pro Tips
Understanding the Colors
Quick Reference
Green/Bullish → Active uptrend
Red/Bearish → Active downtrend
Light Purple → Momentum slowing
Dark Purple → Potential reversal
Gradient → Overall market state