
Dashboard
MTF Dashboard
Monitor 8 timeframes simultaneously to identify trend alignment and market consensus across multiple time horizons.
What is the MTF Dashboard?
The Multi-Timeframe (MTF) Dashboard provides a comprehensive view of market conditions across 8 different timeframes in a single, easy-to-read table. It analyzes trend direction and volatility for each timeframe, helping you identify when multiple timeframes align for high-probability setups.
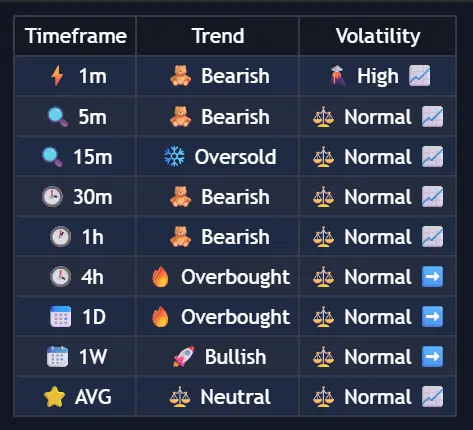
Multi-Timeframe Dashboard
Dashboard Components
Column 1: Timeframe
Displays your selected timeframes with visual indicators:
- Ultra-fast (1-3 min) - Scalping
- Fast (5-15 min) - Day trading
- Medium (30-60 min) - Intraday
- Slow (2-4 hours) - Swing entries
- Daily+ - Position/trend
Column 2: Trend Status
Shows market direction based on momentum analysis:
| Status | Icon | Meaning | Trading Implication |
|---|---|---|---|
| Overbought | Strong upward momentum, extended | Consider taking profits on longs | |
| Oversold | Strong downward momentum, extended | Consider taking profits on shorts | |
| Bullish | Upward trend, healthy momentum | Look for long opportunities | |
| Bearish | Downward trend, healthy momentum | Look for short opportunities |
Column 3: Volatility
Displays market volatility with trend indicators:
| Level | Icon | Meaning | Best For |
|---|---|---|---|
| High | Large price swings | Scalping, breakout trades | |
| Normal | Average movement | Standard strategies | |
| Low | Tight ranges | Range trading, avoid breakouts |
Trend Arrows
- Rising volatility (expansion coming)
- Falling volatility (consolidation)
- Stable volatility
Configuration Settings
Basic Settings
| Setting | Options | Description |
|---|---|---|
| Show MTF Dashboard | On/Off | Toggle dashboard visibility |
| Dashboard Location | Top Right/Left, Bottom Right/Left | Screen position |
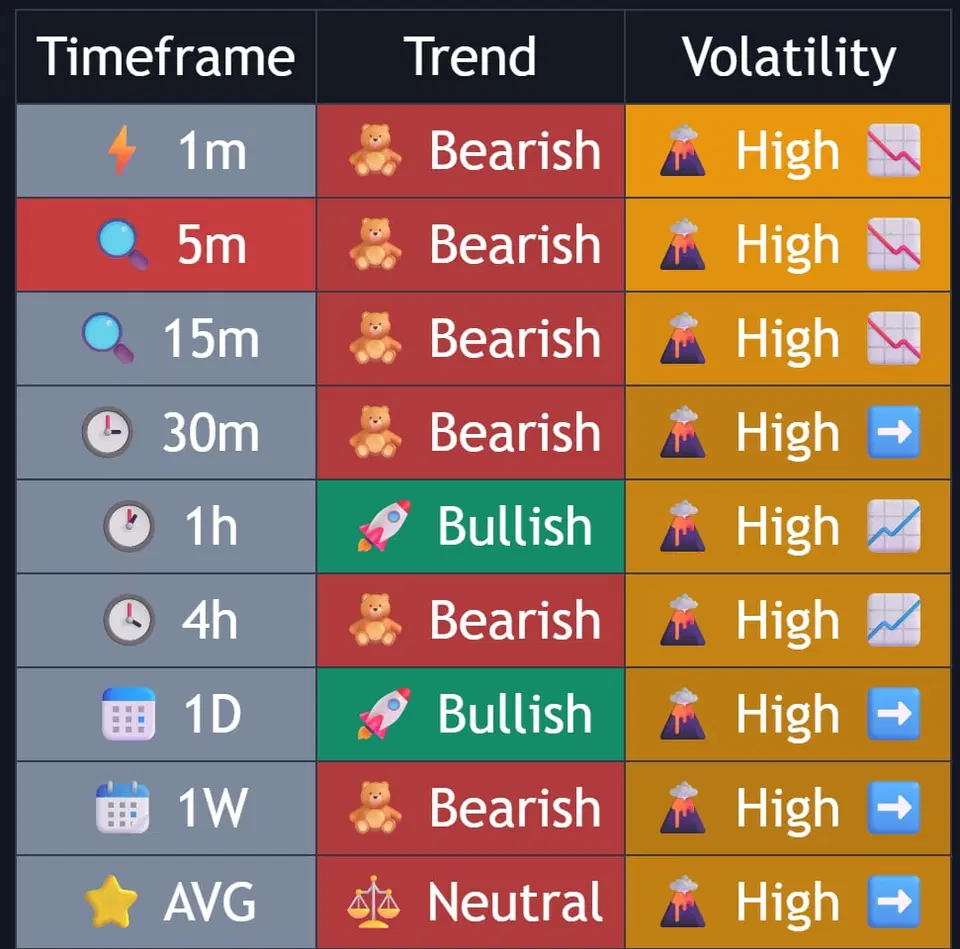
| Dashboard Style | Pro Neutral, Semantic Heatmap | Visual presentation style |
| TF 1-8 | Any timeframe | Select 8 timeframes to monitor |
Dashboard Style Options
Professional zebra row design
- Clean alternating row backgrounds
- Consistent text colors throughout
- Easier on the eyes for extended viewing
- Professional appearance for screenshots
- Best for: Traders who prefer minimal visual distraction
Color-coded cells for quick scanning
- Dynamic cell colors based on conditions
- Instant visual recognition of market state
- Trend strength shown through color intensity
- Volatility levels with distinct color coding
- Best for: Quick market assessment and pattern recognition
Recommended Timeframe Sets
TF1: 1        # 1 minute
TF2: 3        # 3 minutes
TF3: 5        # 5 minutes
TF4: 15       # 15 minutes
TF5: 30       # 30 minutes
TF6: 60       # 1 hour
TF7: 240      # 4 hours
TF8: D        # Daily
Focus: Quick trades with higher timeframe confirmation
TF1: 5        # 5 minutes
TF2: 15       # 15 minutes
TF3: 30       # 30 minutes
TF4: 60       # 1 hour
TF5: 2h       # 2 hours
TF6: 240      # 4 hours
TF7: D        # Daily
TF8: W        # Weekly
Focus: Intraday positions with trend alignment
TF1: 60       # 1 hour
TF2: 2h       # 2 hours
TF3: 240      # 4 hours
TF4: 6h       # 6 hours
TF5: 12h      # 12 hours
TF6: D        # Daily
TF7: W        # Weekly
TF8: M        # Monthly
Focus: Multi-day positions with strong trends
You can input custom timeframes like:
90for 90 minutes3hfor 3 hours2dfor 2 days- Mix any combination that suits your strategy
Reading the Dashboard
The AVG Row (Bottom Summary)
Trend Bias
The AVG row provides overall market assessment:
- Bullish = Majority uptrend
- Bearish = Majority downtrend
- Neutral = Mixed signals
Volatility Summary
Shows dominant market conditions:
- Dominant volatility level (High/Normal/Low)
- Expansion or contraction trend
- Overall market agreement strength
Trading Signals
High-Probability Setups
Strong Alignment (6+ Timeframes)
- Signal: 6 or more timeframes same direction
- Action: Trade in alignment direction
- Alert Available: “MTF Strong Bullish/Bearish”
Full Alignment (8/8 Timeframes)
- Signal: All 8 timeframes same direction
- Action: Maximum position size opportunity
- Alert Available: “MTF Full Alignment”
Bias Flip
- Signal: AVG row changes from Bearish to Bullish (or vice versa)
- Action: Prepare for trend change
- Alert Available: “MTF Bias Flip”
Alert Configuration
Available alerts for the MTF Dashboard:
| Alert Name | Triggers When | Use Case |
|---|---|---|
| MTF Strong Bullish | 6+ timeframes bullish | Entry signal for longs |
| MTF Strong Bearish | 6+ timeframes bearish | Entry signal for shorts |
| MTF Full Bullish Alignment | All 8 timeframes bullish | Rare strong trend signal |
| MTF Full Bearish Alignment | All 8 timeframes bearish | Rare strong trend signal |
| MTF Bias Flip → Bullish | Overall bias turns bullish | Trend reversal signal |
| MTF Bias Flip → Bearish | Overall bias turns bearish | Trend reversal signal |
Pro Strategies
Strategy 1: Alignment Confluence
Wait for strong MTF alignment (6+) to coincide with:
- Order Block test
- Cloud Band edge
- Key support/resistance
Strategy 2: Timeframe Cascade
- Higher timeframes turn bullish first
- Wait for lower timeframes to align
- Enter on lowest timeframe signal
Strategy 3: Volatility Filter
- High volatility + Alignment = Breakout trade
- Low volatility + Alignment = Wait for expansion
- Normal volatility + Alignment = Standard entry
Common Mistakes
Troubleshooting
Dashboard not showing any data
- Ensure “Show MTF Dashboard” is enabled
- Check that you have enough historical data loaded
- Verify timeframe inputs are valid (e.g., “5”, “15”, “60”, “D”)
Some timeframes show “n/a”
- The timeframe may be invalid or not available
- Try standard timeframes: 1, 5, 15, 30, 60, 240, D, W
- Custom timeframes need specific format (e.g., “90” for 90 minutes)
Dashboard updates slowly
- This is normal - it updates with each new bar close
- Higher timeframes update less frequently
- Use lower timeframes for more responsive data
Best Practices
- Start with standard timeframe sets
- Choose a dashboard style that suits your trading approach
- Wait for 6+ timeframe alignment
- Confirm with other Infinity Dashboard features
- Use alerts to catch alignment changes
- Respect the overall AVG bias