
Features
Peak Profit/Leverage
See how your trades would look with leverage — for visualization only.
What It Does
Live Trade Tracking
Shows the highest profit reached since entry, multiplied by leverage.
Example:
- Trade reaches: 2% profit
- Leverage set to: 50x
- Display shows: 100% peak
This helps visualize your maximum potential with leverage.
Performance Calculation
AI Dashboard uses this to show:
- Simulated Total Profit %
- Simulated Total Profit $
See how an AI strategy would perform with your leverage.
Visual Examples
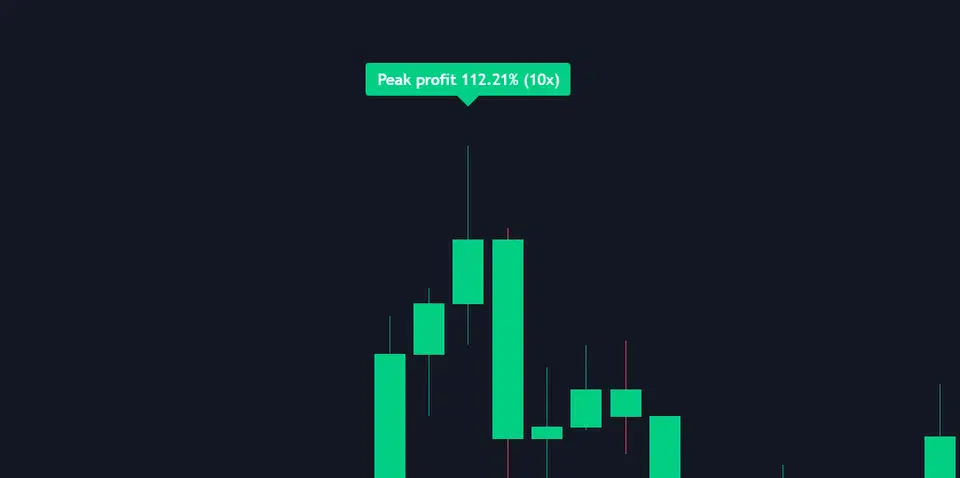
10x Leverage
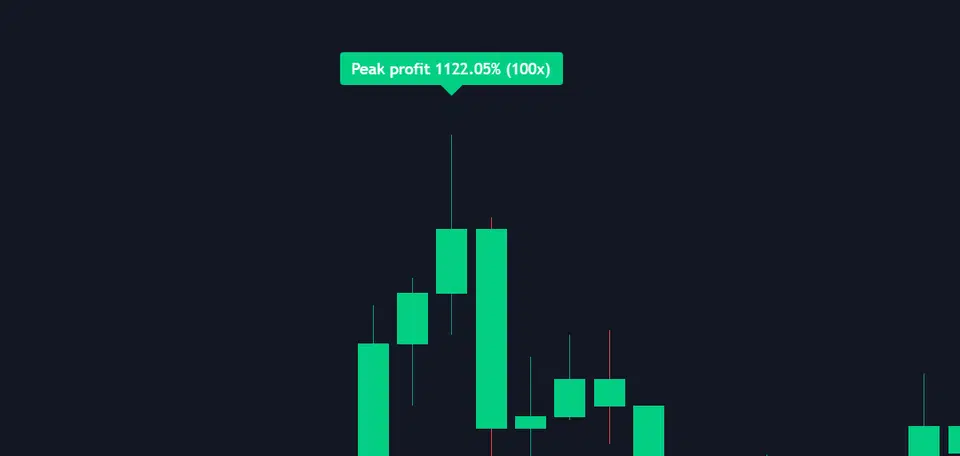
100x Leverage
What It Does Not Do
| Does Not Include | Why It Matters |
|---|---|
| Compounding | Real trading compounds gains/losses |
| Liquidation risk | High leverage can wipe accounts |
| Fees/slippage | Real costs reduce profits |
| Margin calls | Exchanges close losing positions |
| Signal changes | Entry/exit points stay the same |
How to Use
Set Your Real Leverage
Match what you actually trade with (e.g., 10x, 20x)
Watch Peak Profit
See maximum potential during trades
Check AI Dashboard
Compare simulated performance at your leverage
Common Settings
| Trading Style | Typical Leverage | Risk Level |
|---|---|---|
| Conservative | 1-5x | Low |
| Moderate | 5-20x | Medium |
| Aggressive | 20-50x | High |
| Extreme | 50-100x+ | Very High |