
Dashboard
Cloud Bands
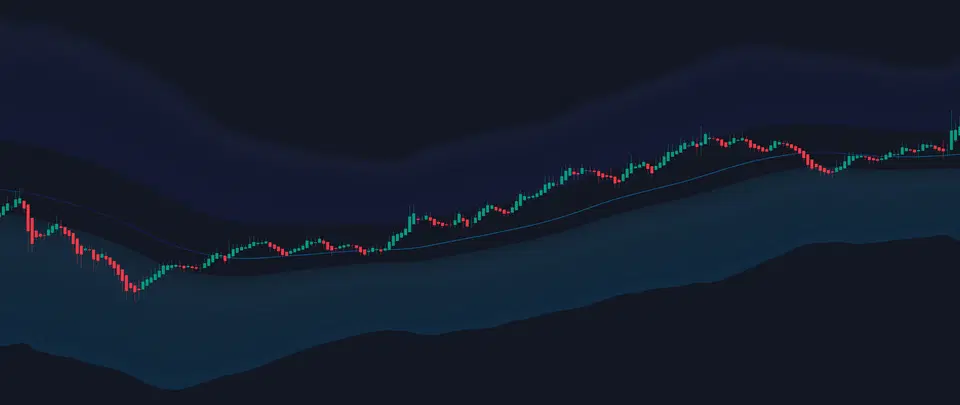
Adaptive volatility envelope that expands and contracts with market conditions, providing dynamic support/resistance levels and trend direction.
What are Cloud Bands?
Cloud Bands create a dynamic volatility envelope around price action, automatically adjusting to market conditions. The bands expand during volatile periods and contract during consolidation, helping you identify trend direction, support/resistance levels, and potential breakout zones.
Key Components
- Upper Cloud - Resistance and overbought zone
- Lower Cloud - Support and oversold zone
- Midband - Dynamic equilibrium level
- Gradient Layers - Volatility intensity visualization
Why They Work
Cloud Bands adapt to market volatility in real time, providing context-aware support and resistance levels that static indicators miss. The multi-layered gradient shows strength levels at a glance.
Understanding the Cloud Structure
Cloud Layers
The cloud consists of multiple bands creating a gradient effect:
| Layer | Location | Meaning | Trading Use |
|---|---|---|---|
| Outer Band | Furthest from price | Extreme overbought/oversold | Reversal zones |
| Middle Layers | Gradient zones | Increasing strength levels | Partial profits |
| Inner Band | Closest to price | Initial support/resistance | First targets |
| Midband | Center line | Dynamic equilibrium | Bias filter |
Dynamic Midband Color Coding
Price Position Indication:
- Green tint - Price above (bullish)
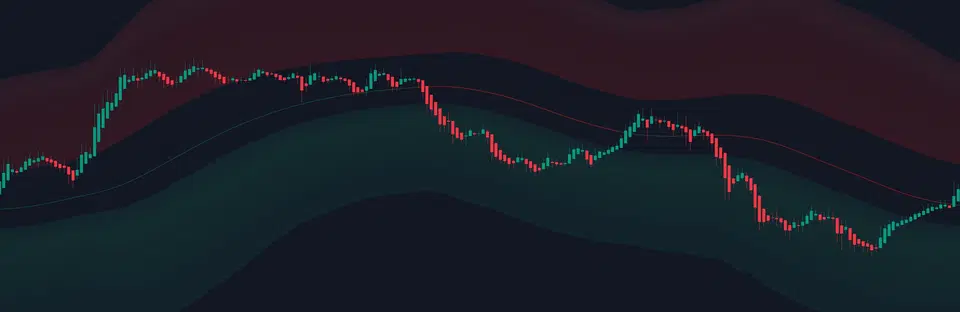
- Red tint - Price below (bearish)
- Neutral - Price at equilibrium
Trading Application:
- Green = Look for longs
- Red = Look for shorts
- Neutral = Wait for direction
Configuration Settings
Basic Settings
| Setting | Options | Default | Description |
|---|---|---|---|
| Show Cloud Bands | On/Off | ON | Toggle cloud visibility |
| Cloud Period Mode | Auto/Manual | Auto | Adaptive or fixed period |
| Manual Period | 5-400 | 80 | Custom period (Manual mode only) |
| Show Cloud Midline | On/Off | ON | Display center equilibrium line |
Period Mode Guide
Automatic adaptation based on timeframe:
The system intelligently calculates optimal periods:
- 1-5 min: Ultra-responsive settings
- 15-60 min: Balanced intraday
- 4H-Daily: Smooth swing trading
- Weekly+: Major trends only
Benefits:
- No manual adjustment needed
- Optimized for each timeframe
- Reduces false signals
Best for: 95% of traders
Fixed period settings guide:
| Period Range | Characteristics | Best For |
|---|---|---|
| 20-40 | Very responsive, many signals | Scalping |
| 60-80 | Balanced sensitivity | Day trading |
| 100-150 | Smooth, fewer whipsaws | Swing trading |
| 200+ | Major trends only | Position trading |
When to use:
- Specific strategy requirements
- Backtesting consistency
- Personal preference
Best for: Advanced users with specific needs
Trading Signals
Cloud Breakouts
Bullish Breakout:
- Price closes above upper cloud
- Cloud is sloping upward
- Volume confirmation ideal
Bearish Breakout:
- Price closes below lower cloud
- Cloud is sloping downward
- Strong momentum signal
Cloud Squeeze
Characteristics:
- Cloud Bands converge (narrow)
- Low volatility period
- Energy building for move
Trading approach:
- Mark the squeeze zone
- Wait for expansion direction
- Trade the breakout with tight stops
Midband Crosses
Signals:
- Cross above = Bullish bias shift
- Cross below = Bearish bias shift
- Multiple tests = Strong level
Confirmation:
- Check cloud slope
- Verify MTF alignment
- Look for volume
Trading Strategies
Strategy 1: Cloud Edge Bounce
Setup:
- Price approaches cloud edge in trending market
- Look for rejection candles
- Enter on bounce with tight stop
- Target opposite cloud edge or midband
Best for: Trending markets with clear cloud slope
Strategy 2: Breakout Trading
Setup:
- Identify cloud squeeze (narrow bands)
- Wait for decisive break with volume
- Enter on retest of cloud edge
- Stop below/above cloud
- Target = 2x cloud width
Best for: Range breakouts and momentum trades
Strategy 3: Mean Reversion
Setup:
- Price at outer cloud extreme
- Look for reversal patterns
- Enter targeting midband
- Stop beyond cloud extreme
Best for: Overextended markets
Visual Interpretation
Cloud Colors and Opacity
Color Intensity:
- Darker/opaque = Higher volatility
- Lighter/transparent = Lower volatility
- Red gradient = Resistance zones
- Green gradient = Support zones
Trading Meaning:
- Dark = Use wider stops
- Light = Tighten risk
- Red = Sell zones
- Green = Buy zones
Cloud Slope Analysis
| Slope | Visual | Meaning | Trading Bias |
|---|---|---|---|
| Steep up | 45°+ | Strong uptrend | Long only |
| Gentle up | 15-45° | Weak uptrend | Long preferred |
| Flat | 0-15° | Ranging market | Both directions |
| Gentle down | 15-45° | Weak downtrend | Short preferred |
| Steep down | 45°+ | Strong downtrend | Short only |
Alert Configuration
| Alert Name | Triggers When | Use Case | Setup |
|---|---|---|---|
| Cloud Breakout Up | Price breaks above upper cloud | Momentum long entry | Slope must be up |
| Cloud Breakout Down | Price breaks below lower cloud | Momentum short entry | Slope must be down |
| Cloud Midband ↑ | Price crosses above midband | Bias shift to bullish | Watch for confirmation |
| Cloud Midband ↓ | Price crosses below midband | Bias shift to bearish | Watch for confirmation |
Pro Tips
Reading Market Conditions
| Cloud Width | Market State | Strategy |
|---|---|---|
| Very Wide | High volatility | Wide stops, smaller size |
| Normal | Balanced | Standard approach |
| Narrow | Low volatility | Breakout pending |
| Expanding | Volatility increasing | Trend starting |
| Contracting | Consolidation | Prepare for move |
- Higher TF cloud: Major trend direction
- Current TF cloud: Trade execution
- Lower TF cloud: Fine-tuning entries
- All aligned: Highest probability
- Mixed: Stay cautious
| Component | Guideline |
|---|---|
| Stop Placement | Beyond cloud extreme |
| Position Sizing | Inverse to cloud width |
| Take Profit 1 | Midband |
| Take Profit 2 | Opposite cloud edge |
| Trail Stop | Along midband |
Combining with Other Features
Powerful Combinations
With Order Blocks:
- Cloud edge + Order Block = High-probability reversal
- Breakout + Clear block = Momentum continuation
- Squeeze at OB = Explosive move pending
With Market Structure:
- CHoCH at cloud extreme = Major reversal
- BOS with cloud breakout = Strong trend
- Structure within cloud = Weak signal
With MTF Dashboard:
- Cloud breakout + 6+ TF aligned = Highest conviction
- Midband cross + MTF flip = Trend change confirmed
- Squeeze + MTF divergence = Stay out
Common Mistakes
Troubleshooting
Cloud not showing
- Check “Show Cloud Bands” is enabled
- Ensure sufficient price history loaded
- Try switching between Auto/Manual mode
- Verify chart has enough data points
- Some instruments may need manual period adjustment
Cloud too wide/narrow
- Auto mode: Adapts automatically - if still wrong, try Manual
- Manual mode adjustments:
- Too wide → Decrease period (try -20)
- Too narrow → Increase period (try +20)
- Consider your timeframe (lower TF = lower period typically)
Midband not visible
- Enable “Show Cloud Midline” in settings
- May be hidden behind price candles
- Check if it’s the same color as background
- Try zooming in/out
Cloud appears choppy
- Normal on very low timeframes (1-5m)
- Solutions:
- Increase period in manual mode
- Use higher timeframe (15m+)
- Switch to Auto mode
- Enable smoothing if available
Quick Reference
Visual Cues at a Glance
Cloud Width:
- Wide = High volatility
- Narrow = Low volatility (squeeze)
- Expanding = Trend starting
- Contracting = Range forming
Colors and Slope:
- Green midband = Bullish bias
- Red midband = Bearish bias
- Steep slope = Strong trend
- Flat cloud = Range-bound
Trading Rules Checklist
- Trade with the cloud slope direction
- Enter at edges, not middle
- Adjust stop width to cloud width
- Watch for squeeze setups
- Use midband as bias filter
- Confirm with other features
- Respect cloud extremes