
Dashboard
Order Blocks
Identify institutional supply and demand zones with volume analysis to find high-probability reversal and continuation areas.
What are Order Blocks?
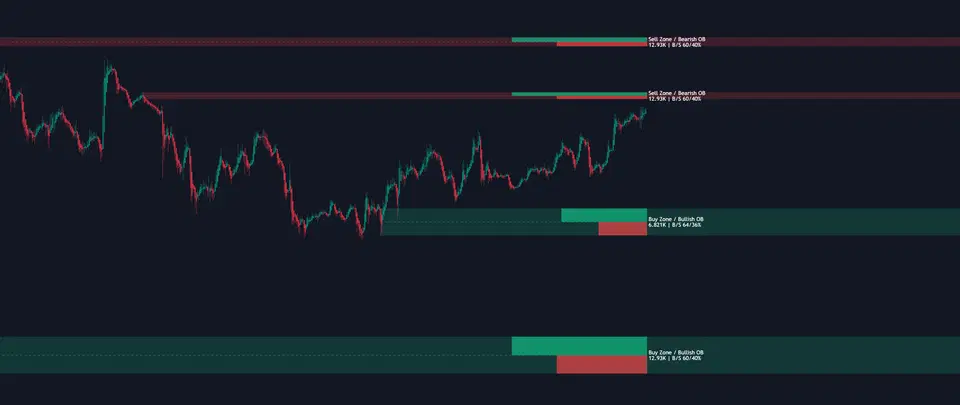
Order Blocks represent areas where institutional traders likely placed large orders, creating zones of supply (resistance) and demand (support). These zones often act as magnets for price, providing excellent entry and exit opportunities.
Key Components
- Buy Zones (Bullish OB) - Demand areas where buyers stepped in
- Sell Zones (Bearish OB) - Supply areas where sellers took control
- Volume Metrics - Buy/sell pressure within each zone
Why They Work
Order Blocks show where “smart money” entered positions, giving you institutional-level insight into Market Structure and potential reversal points.
Understanding Order Block Components
Zone Structure
Each Order Block displays:
| Component | Description | Trading Use |
|---|---|---|
| Colored Box | The zone boundaries | Entry/exit area |
| Volume Bar | Buy (green) / Sell (red) split | Strength indicator |
| Text Label | Zone type and metrics | Quick reference |
Volume Metrics Display
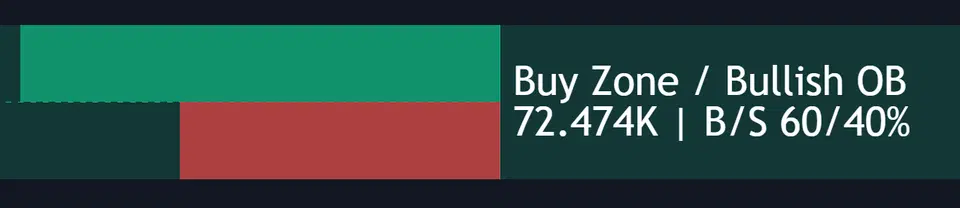
Buy Zone / Bullish OB
72.474K | B/S 60/40%
Reading the metrics:
- 72.474K - Total volume in the zone
- 60% Buy - Bullish pressure dominance
- 40% Sell - Minimal selling
Configuration Settings
Basic Settings
| Setting | Options | Default | Description |
|---|---|---|---|
| Show Buy Sell Zones | On/Off | ON | Enable/disable Order Blocks |
| Show Only Nearest Boxes | On/Off | ON | Display only closest zone to price |
| Extend Boxes Indefinitely | On/Off | OFF | Keep zones visible until broken |
| Show Breaks | On/Off | OFF | Mark when zones are broken |
| Show Exit Markers | On/Off | OFF | Display exit signals from zones |
| Exit Trigger Mode | Close/Wick | Wick | How exits are detected |
| Show OB Details | On/Off | ON | Display metrics, midline, volume bars |
Advanced Settings
| Setting | Description | Impact |
|---|---|---|
| Sensitivity | Zone detection sensitivity (1-100) | Higher = fewer, larger zones |
| OB Mitigation Method | When zone is “broken” | Close = strict, Wick = sensitive, Mid = balanced |
| Hide Overlap | Auto-hide overlapping zones | Keeps chart clean |
| Fib Factor | Breakout confirmation (0-1) | Higher = stricter bias changes |
| Max OBs per Side | Maximum zones displayed | 3-5 for clean charts, 10+ for analysis |
| OB Max History | Lookback period in bars | Lower for performance, higher for context |
Types of Order Blocks
Fresh Order Blocks
- Characteristics: Never been tested by price
- Probability: Highest for reaction
- Strategy: First test often produces best move
Tested Order Blocks
- Characteristics: Price touched but didn’t break
- Probability: Medium strength
- Strategy: Look for multiple confluences
Broken Order Blocks
- Characteristics: Price closed through zone
- Probability: Often flips role
- Strategy: Old support becomes resistance (and vice versa)
Trading Signals
Entry Signals
Setup:
- Price approaches fresh Order Block
- Look for slowdown or rejection candles
- Enter at zone edge or midline
- Stop below/above zone
Best for: Conservative traders, trending markets
Setup:
- Zone breaks (triangle marker appears)
- Price returns to test old zone
- Enter on rejection
- Stop beyond zone extreme
Best for: Aggressive traders, reversal plays
Setup:
- Wait for price to reach zone midline
- Look for reaction at this level
- Enter with tight stop
- Target opposite zone
Best for: Scalpers, precise entries
Exit Signals
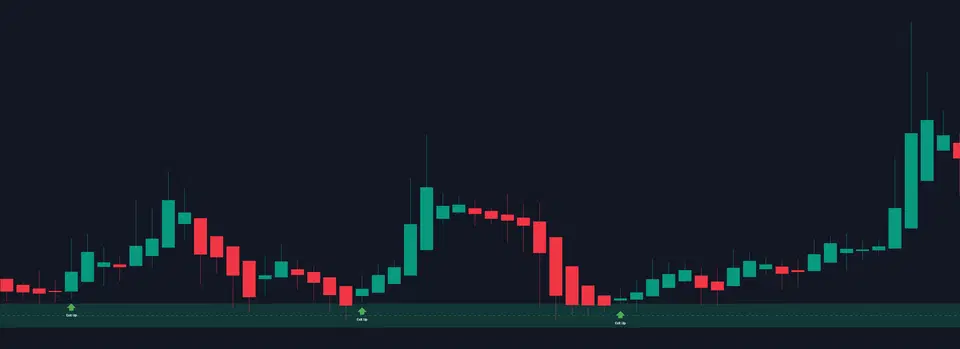
Exit signal showing price leaving a bullish Order Block with upward momentum
Exit Markers show when price leaves a zone:
- Green arrow = Exiting bullish zone upward (bullish continuation)
- Red arrow = Exiting bearish zone downward (bearish continuation)
Exit Trigger Modes:
- Close - Bar must close outside zone (conservative)
- Wick - Any price spike through zone (aggressive)
Break Signals
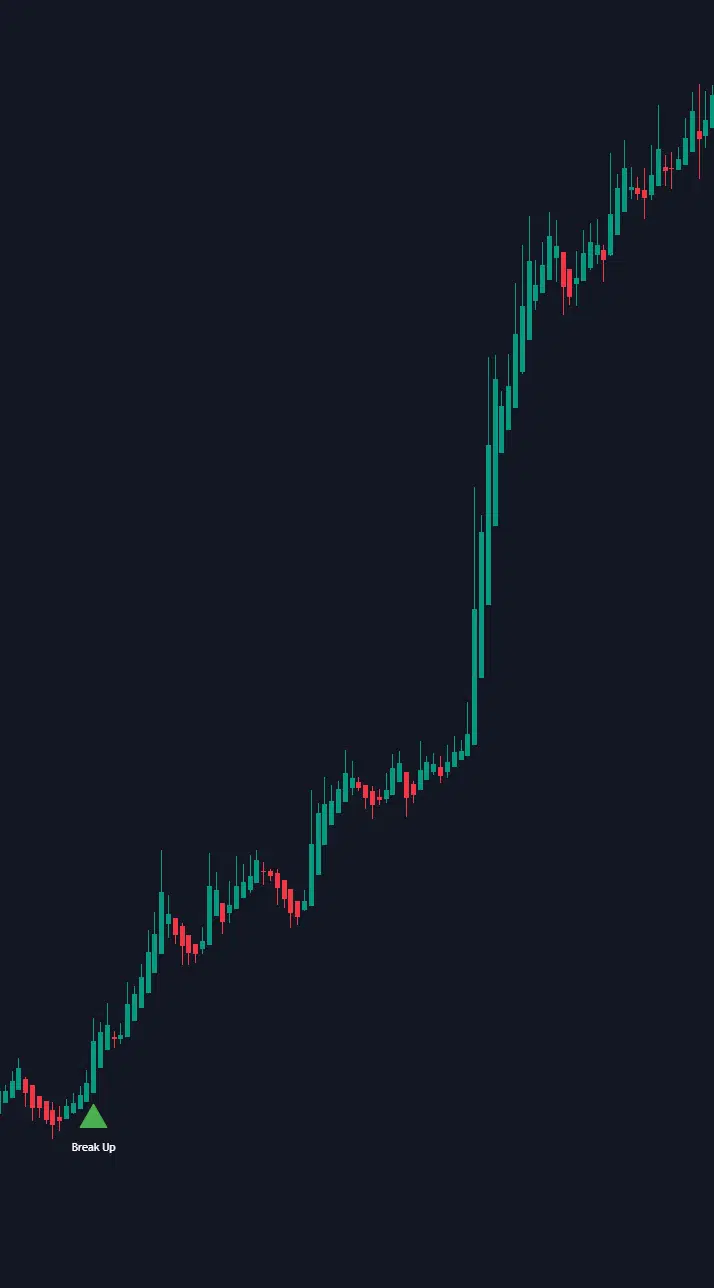
Break signals mark zone invalidation and potential role reversal
Break Markers indicate when a zone is definitively broken:
- Red triangle down = Bullish zone broken (bearish signal)
- Green triangle up = Bearish zone broken (bullish signal)
Understanding Breaks:
When Zones Break:
- Price closes beyond zone boundary
- Volume confirms the move
- Zone loses its effectiveness
- Often flips from support to resistance (or vice versa)
Trading Breaks:
- Immediate signal for trend continuation
- Wait for retest for safer entry
- Old support becomes new resistance
- Old resistance becomes new support
Mitigation Methods (determines when a break occurs):
| Method | Trigger Condition | Best For |
|---|---|---|
| Close | Bar closes beyond zone edge | Conservative |
| Wick | Any price spike through zone | Aggressive |
| Mid | Close crosses zone midline | Balanced approach |
Volume Analysis
Reading Buy/Sell Pressure
The colored bars within zones show:
- Green portion = Buying volume percentage
- Red portion = Selling volume percentage
- Bar width = Proportional to zone width
Strength Interpretation:
- 80/20 split = Very strong zone
- 70/30 split = Strong zone
- 60/40 split = Moderate strength
- 50/50 split = Neutral, avoid
Pro Strategies
Strategy 1: Zone-to-Zone Trading
Trade from one Order Block to the opposite side:
- Enter at demand zone (bullish OB)
- Target supply zone (bearish OB)
- Reverse at supply
- Target demand zone
Best when: Clear range-bound market with defined zones
Strategy 2: Confluence Stacking
Strongest setups have multiple factors:
- Order Block + MTF alignment (6+ timeframes)
- Order Block + Cloud Band edge
- Order Block + Market Structure level (BOS/CHoCH)
- Order Block + Round numbers
Best when: Looking for high-probability entries
Strategy 3: Volume Gradient Trading
Focus on zones with extreme volume imbalances:
- Enter zones with >80% directional volume
- Avoid zones with <60% directional volume
- Use midline for partial profits
- Hold runners to opposite extreme zone
Best when: Trending markets with clear momentum
Alert Configuration
| Alert Name | Triggers When | Use Case |
|---|---|---|
| Entered Bullish OB | Price enters buy zone | Potential long entry |
| Entered Bearish OB | Price enters sell zone | Potential short entry |
| Bullish OB Break Down | Buy zone broken | Zone invalidation/flip |
| Bearish OB Break Up | Sell zone broken | Zone invalidation/flip |
| Exit from Bullish OB | Leaving buy zone up | Potential long entry |
| Exit from Bearish OB | Leaving sell zone down | Potential long entry |
Optimization Tips
Show Only Nearest: ON
Extend Boxes: OFF
Exit Trigger Mode: Wick
Max OBs: 3 per side
Sensitivity: 10-15 (more zones)
OB Max History: 500 bars
Mitigation: Wick
Show Only Nearest: ON
Extend Boxes: OFF
Exit Trigger Mode: Close
Max OBs: 5 per side
Sensitivity: 15-20 (balanced)
OB Max History: 1000 bars
Mitigation: CloseShow Only Nearest: OFF
Extend Boxes: ON
Exit Trigger Mode: Close
Max OBs: 10 per side
Sensitivity: 20-30 (quality zones)
OB Max History: 2000 bars
Mitigation: MidShow Only Nearest: OFF
Extend Boxes: ON
Exit Trigger Mode: Close
Max OBs: 10+ per side
Show OB Details: ON
Show Breaks: ON
Show Exit Markers: ON
All visual features enabledCommon Mistakes
Troubleshooting
No order blocks showing
- Check “Show Buy Sell Zones” is enabled
- Increase “OB Max History” setting (try 1000+)
- Ensure you have enough chart history loaded
- Try adjusting sensitivity (lower = more zones)
- Check if price has been trending without pullbacks
Too many overlapping boxes
- Enable “Show Only Nearest Boxes”
- Enable “Hide Overlap” option (if available)
- Reduce “Max OBs per Side” to 3-5
- Increase sensitivity for fewer, larger zones
Volume metrics showing “n/a”
- Need more historical data loaded
- Increase “OB Max History” to 1000+
- Some instruments may lack volume data
- Check if volume is available for your symbol
Zones disappearing unexpectedly
- This is normal when zones are “mitigated” (broken)
- Check your “OB Mitigation Method” setting
- Broken zones are removed to keep chart clean
- Consider enabling “Extend Boxes” to keep them visible
Exit markers not showing
- Enable “Show Exit Markers” in settings
- Check “Exit Trigger Mode” (Wick vs Close)
- Ensure price actually exited the zone
- May need to wait for bar close (if using Close mode)
Quick Reference
Visual Elements
Zone Colors:
- Green zones = Demand/Support (Bullish OB)
- Red zones = Supply/Resistance (Bearish OB)
- Dashed midline = Zone center/target
- Split bars = Volume distribution
Markers:
- Triangle up = Bearish zone broken (bullish)
- Triangle down = Bullish zone broken (bearish)
- Arrow up = Exiting zone upward
- Arrow down = Exiting zone downward
Best Practices Checklist
- Focus on fresh, untested zones
- Confirm with volume metrics (>70% directional)
- Use midlines for precise targets
- Combine with MTF Dashboard alignment
- Respect broken zones as role reversals
- Match Exit Trigger Mode to your style
- Keep chart clean with nearest zones only