
Features
Entry, Take Profit and Stop Loss

Settings Overview
Entry Level Display
Purpose: Shows your position entry with dotted line
Enabled
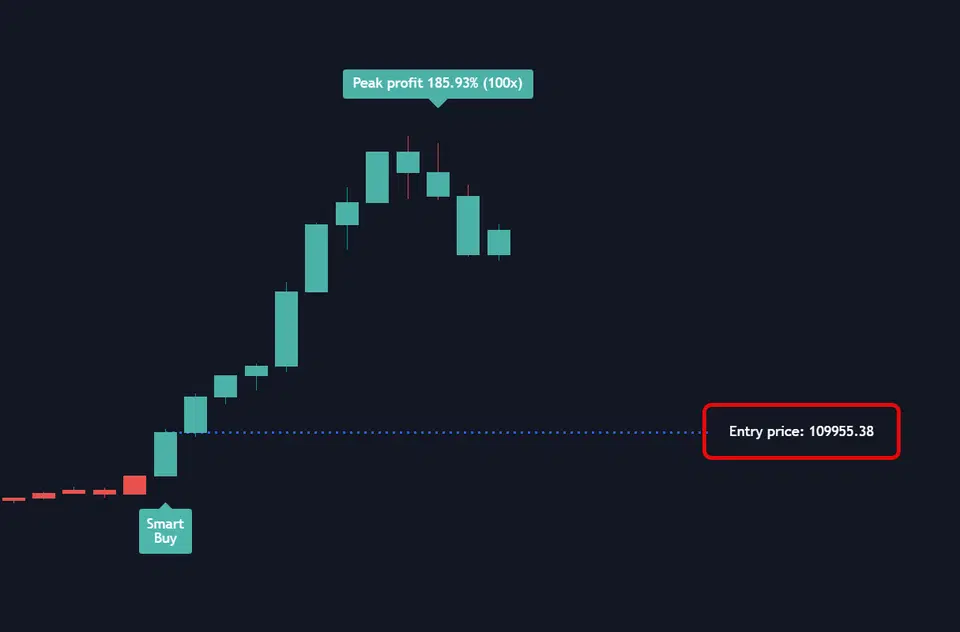
Line visualization: Entry Price enabled
TP Levels Configuration
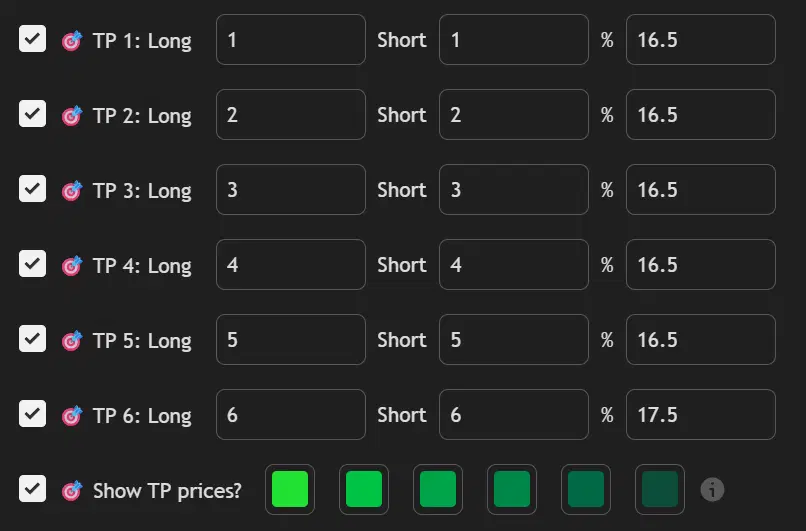
Setup Process:
Enable TP Level
Toggle ON the TP levels you want
Set Percentage
Define profit % for each level
Assign Position %
Set how much to exit at each TP
Verify Total = 100%
Sum of all exit % must equal 100
Configuration Examples:
Single TP:
TP1: 2% profit, exit 100%
Multiple TPs:
TP1: 1% profit, exit 50%
TP2: 2% profit, exit 30%
TP3: 3% profit, exit 20%
Total: 100%Visual Display: Enable “Show TP Prices” for dotted lines on chart
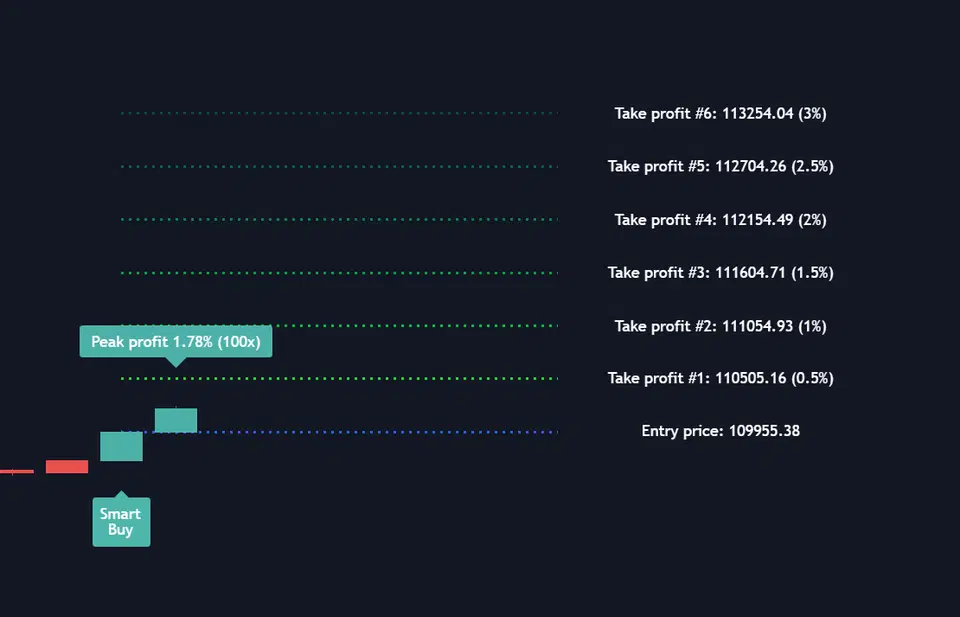
Line visualization: all 6 TPs enabled
Stop Loss Setup
Configure separately for Long and Short positions

Long Position SL
Set % below entry for longs
- Example: 2% = Exit if -2%
Short Position SL
Set % above entry for shorts
- Example: 2% = Exit if -2%
Visual Display: Enable “Show SL Price” for dotted line on chart
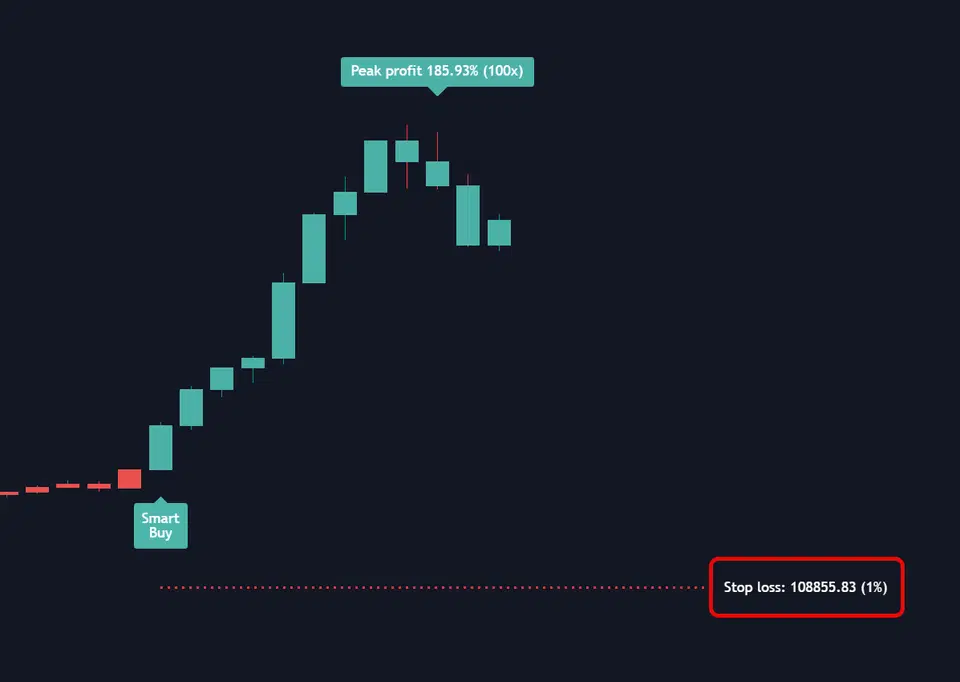
Line visualization: SL enabled
Advanced SL Management
Three Trailing Modes Available:

| Mode | Description | How It Works |
|---|---|---|
| None | Static stop loss | SL stays at initial level |
| Breakeven | Move to entry | SL moves to entry price after trigger |
| Moving Target | Follow TP levels | SL trails up to previous TP levels |
Setup Process:
Select Trailing Mode
Choose from None, Breakeven, or Moving Target
Set Trigger Point
Select which TP triggers the trailing (TP1-TP6)
Monitor Status
Chart shows (BE) or (TP1), (TP2) etc. next to SL
Example Configurations:
Breakeven Mode:
- Mode: Breakeven
- Trigger: After TP1
- Result: SL moves to entry when TP1 hits
- Display: "Stop loss (BE)"
Moving Target Mode:
- Mode: Moving Target
- Trigger: After TP2
- Result:
* After TP2: SL → Entry
* After TP3: SL → TP1
* After TP4: SL → TP2
- Display: "Stop loss (TP1)", etc.Visual Indicators:
| SL Status | Label Display | Meaning |
|---|---|---|
| Normal | “Stop loss: [price]” | Static SL active |
| Breakeven | “Stop loss (BE): [price]” | SL moved to entry |
| Trailing TP1 | “Stop loss (TP1): [price]” | SL at TP1 level |
| Trailing TP2 | “Stop loss (TP2): [price]” | SL at TP2 level |
Visual Display & Behavior
What Shows on Chart:
| Level | Display | Line Style | When Visible | Special Notes |
|---|---|---|---|---|
| Entry | Dotted line | Dashed | When enabled | Dims when SL at BE |
| TP Levels | Dotted line | Dashed | Percentage mode only | Replaced by dots when hit |
| Stop Loss | Dotted line | Dashed | When enabled | Shows trailing status |
Chart Examples:
Active TP Lines
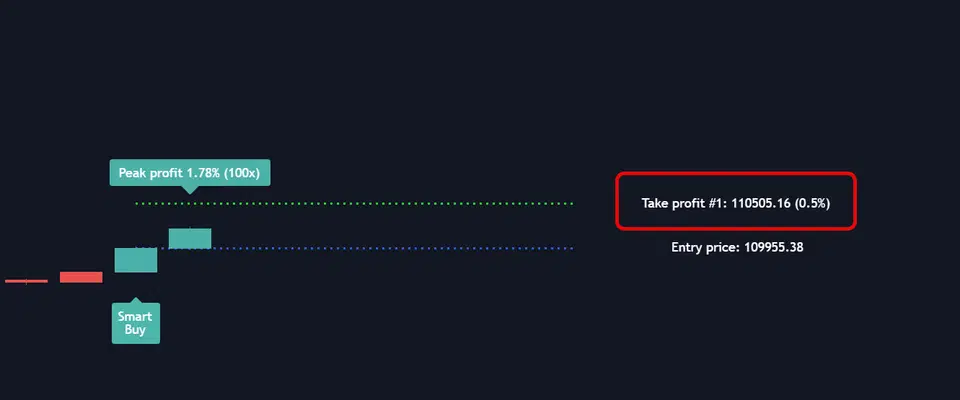
Lines show pending TP levels
TP Hit Markers
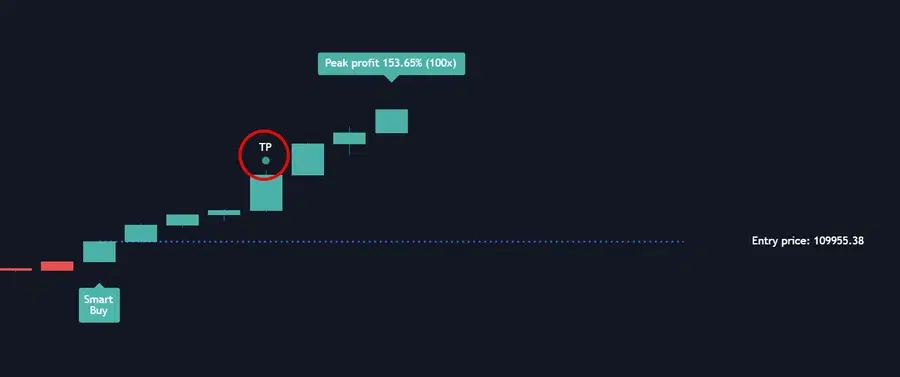
Dots mark executed TPs
Visual Indicators Guide
TP Level Status:
| Status | Visual | Description | Chart State |
|---|---|---|---|
| Pending TP | Dotted line | Ready to trigger | Label shows target |
| TP Hit | Dot marker | Level executed | Line disappears |
| Position Closed | Dots remain | Trade complete | All lines cleared |
SL Trailing Status:
| Status | Visual | Description | Notes |
|---|---|---|---|
| Static | “Stop loss: [price]” | Fixed SL position | Initial state |
| Breakeven | “Stop loss (BE): [price]” | Moved to entry | Risk-free trade |
| Trailing | “Stop loss (TP#): [price]” | Following TP levels | Profits locked |
Quick Setup Templates
Conservative (Single TP + Breakeven)
TP1: 2% profit, exit 100%
SL: 1% loss
Trailing: Breakeven after TP1
Risk/Reward: 2:1 → Risk-free after TP
Scaled Exit (Multiple TP + Moving Target)
TP1: 1% profit, exit 50%
TP2: 2% profit, exit 30%
TP3: 3% profit, exit 20%
SL: 2% loss
Trailing: Moving Target after TP1
Result: Progressive profit locking
Aggressive (Wide Targets + Late Trailing)
TP1: 3% profit, exit 40%
TP2: 5% profit, exit 30%
TP3: 8% profit, exit 30%
SL: 3% loss
Trailing: Moving Target after TP2
Result: Maximum profit potential