
Features
AI Optimization
Transform Infinity Algo into a self-improving system that adapts to markets automatically.
Quick Setup
Enable AI
Turn ON
Enable AI Optimizationin settingsChoose Mode
- Backtesting? →
Static (Full History) - Live Trading? →
Walk-Forward
- Backtesting? →
Select Signal Type
Choose
AIorAI Sniperin Signal Mode
That’s it! Default settings work for most users.
How AI Works
| Simulate | Evaluate | Apply |
|---|---|---|
| Tests 100s-1000s of parameter combinations | Scores each using your metric | Implements best configuration |
Walk-Forward: Periodically re-optimizes on a rolling in-sample window and validates out-of-sample, reducing overfitting.
Core Settings
Optimization Modes
| Mode | How It Works | Use For |
|---|---|---|
| Walk-Forward | Updates every N bars | Live trading |
| Static | Optimizes once, locks | Backtesting |
Walk-Forward Only
100 bars (default) → Ultra-responsive (high CPU)
200-1000 bars     → Balanced
1000-5000 bars    → Very stable, slower to adapt

Examples on 1h chart:
- 100 bars = ~4 days
- 1000 bars = ~42 days
- 5000 bars = ~208 days
Lower = More responsive but intensive | Higher = More stable and efficient
Parameter Space
| Range | Values | Best For |
|---|---|---|
| Very Fast | 5-9 | Scalping |
| Fast | 10-14 | Day Trading |
| Balanced | 10-20 | Most Strategies |
| Medium | 15-21 | Swing Trading |
| Slow | 22-28 | Position Trading |
| Auto | 5-28 | Full exploration |
Choose Your Goal
Quick Selection:
| Your Style | Use This Metric | Why |
|---|---|---|
| Scalping | Win Rate | Consistency matters |
| Day Trading | Sharpe Ratio | Balance risk/return |
| Swing | Sortino Ratio | Downside protection |
| Position | Calmar Ratio | Avoid drawdowns |
All Available Metrics:
- Classic: Total Profit, Win Rate, Average P&L, Gain-to-Pain
- Risk-Adjusted: Sharpe, Sortino, Calmar, Martin
- Advanced: SQN (System Quality Number), Robust ML Score
Simulation Settings
AI Sim TP% (Testing Only)
What they do:
- Help AI evaluate strategies
- Set internal profit targets
- Default: 1.0% both directions
Long TP: 1.0%
Short TP: 1.0%
Purpose: AI testing only
Real trades: Not affected
Dashboard Display
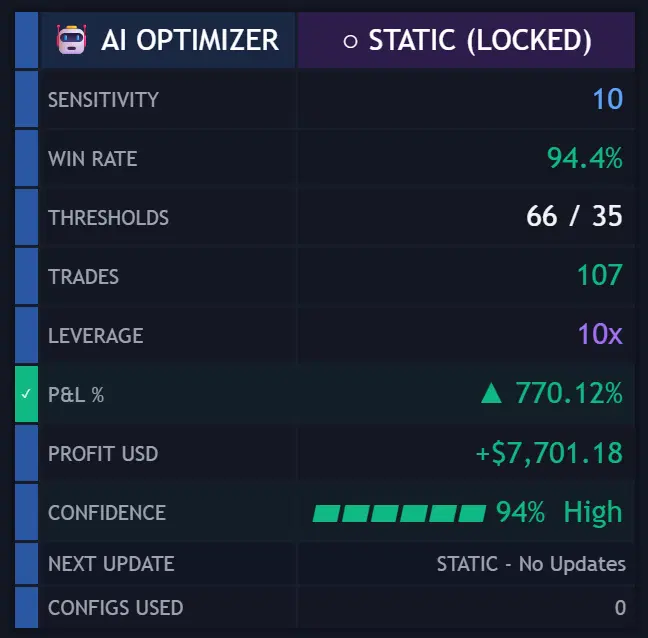
Live Monitoring
When enabled, see:
- Current optimal sensitivity
- Selected thresholds
- Win rate & metrics
- Confidence score
- Mode status
Status Indicators:
STATIC (LOCKED)— One-time optimization completeOPTIMIZING— Currently calculatingSIMULATED— Results ready
Best Practices
- Use Static for initial testing
- Select Balanced sensitivity
- Default 100 bar frequency
- Match metric to goals
- Walk-Forward needs ~535 bars for first optimization
- Static needs ~5000 bars total
- Lower timeframes → Complex calculations
- Monitor dashboard → Track selections
- Small adjustments → Better results
- Patience required → AI needs time
Limits:
- Max lookback: 5000 bars
- Lower frequency = Higher CPU
- Static = One calculation only at bar 4900
- Higher TF = Better performance
Troubleshooting
| Problem | Solution |
|---|---|
| Timeout | Use Static or increase frequency |
| No signals | Check AI Optimization is ON |
| Poor results | Try different metric/range |
| No dashboard | Enable in settings |
| Static fails | Need 5000+ bars data |
Quick Reference
For Testing
- Mode:
Static - Range:
Balanced - Metric:
Total Profit - Frequency: N/A
- Min bars: 5000
For Live Trading
- Mode:
Walk-Forward - Range:
Balanced - Metric: Your preference
- Frequency:
100(default) - Min bars: 535
Understanding Performance Metrics
Detailed Metric Explanations
Classic Metrics
| Metric | Formula | Best For |
|---|---|---|
| Total Profit | Sum of all P&L | Quick assessment |
| Win Rate | Wins ÷ Total trades × 100 | Consistency check |
| Average P&L | Total P&L ÷ Trades | Trade quality |
| Gain-to-Pain | Σ gains / |Σ losses| | Risk/reward balance |
Risk-Adjusted Metrics
Sharpe Ratio — Industry Standard
- Formula: Excess return (over risk-free) ÷ Standard deviation
- Infinity Algo: Uses risk-free = 0
- Pros: Most widely used, easy comparison, considers total volatility
- Cons: Penalizes upside volatility, assumes normal distribution
- Benchmarks: ~1 = Good | ~2 = Very good | 3+ = Outstanding
Sortino Ratio — Downside Focus
- Formula: Excess return (over target/MAR) ÷ Downside deviation
- Infinity Algo: Uses MAR = 0
- Pros: Only penalizes bad volatility, better for trend following
- Cons: Requires defining target return, less standardized
- Benchmarks: >1 = Good | >2 = Very good | >3 = Excellent
Calmar Ratio — Drawdown Protection
- Formula: CAGR ÷ Maximum drawdown (commonly 36 months)
- Pros: Focus on capital preservation, easy to understand
- Cons: Based on single worst event, backward-looking
- Benchmarks: >1 = Good | 3–5 = Strong
Martin Ratio — Ulcer Performance
- Formula: Excess return ÷ Ulcer Index (RMS of drawdowns)
- Pros: Considers all drawdowns, smooth equity curve focus
- Cons: Less known/comparable, complex calculation
- Use: Compare across your strategies
SQN — System Quality Number
- Formula: (Expectancy ÷ Std Dev) × √Number of trades
- Pros: Accounts for sample size, good for system comparison
- Cons: Requires sufficient trades for validity
- Benchmarks: >2 = Good | >3 = Excellent | >5 = Superb
Choosing by Trading Style
| Style | Primary Metrics | Secondary Metrics |
|---|---|---|
| Scalping | Win Rate + Sharpe | Total Profit |
| Day Trading | Sharpe + Win Rate | Average P&L |
| Swing Trading | Sortino + Calmar | Gain-to-Pain |
| Position Trading | Calmar + Martin | Sortino |